On the compiler team's review queue
Some stats and graphs about the compiler team's review queue..
We’ve been discussing the review queue in the team lately and I thought it would be interesting to collect some data and see if the reality of the review queue matches our shared understanding of it.
I wrote a simple Rust utility which queried the GitHub API’s pull request list endpoint and added the relevant data to a local SQLite database, and then wrote some SQL queries to pull the relevant information out into CSV files and then ran those through a small Python script using Plotly to generate these graphs.
A limitation of this data is that I only consider a pull request as having been manually-assigned (where r? is used to explicitly select a reviewer) if that happens in the description of the pull request. I wanted to avoid having to make an API request per pull request, and instead get everything I needed from the list pull requests endpoint, otherwise data collection would have taken considerably longer (~680 requests vs ~68000 requests).
Another limitation is that I’m only considering merged pull requests. I wanted to be able to filter pull requests to only those which changed the compiler. I decided that the most reliable way to do this was check which files were modified and filter out those that didn’t touch rustc. I would have had to make another per-PR API request to collect this information, and I didn’t want to do that, so instead I used the merge commit SHA from the list pull requests API and looked up a local clone of the repository to get a list of modified files from a pull requests - necessarily limiting my data to merged pull requests.
I considered a pull request as modifying the compiler if it changed files in the following paths:
compiler/*
tests/{assembly, codegen,coverage-map,coverage,debuginfo,incremental,mir-opt,run-coverage,run-make-fulldeps,run-make,ui,ui-fulldeps}/*
src/rustc_*
src/librustc_*
src/libsyntax*
src/test/{assembly,codegen,codegen-units,compile-fail,compile-fail-fulldeps,debuginfo,incremental,incremental-fulldeps,mir-opt,parse-fail,pretty,run-make,run-make-fulldeps,run-pass,run-pass-fulldeps,run-fail,ui,ui-fulldeps}/*
For reasons that I didn’t investigate, this approach didn’t seem to work for pull requests prior to early 2017 and so my data basically starts around then. I added a mostly arbitrary threshold to the pull request creation date of 01/01/2016 to all of my queries, and within that data, there were 53,891 total pull requests, 42,638 merged and 10,554 closed.
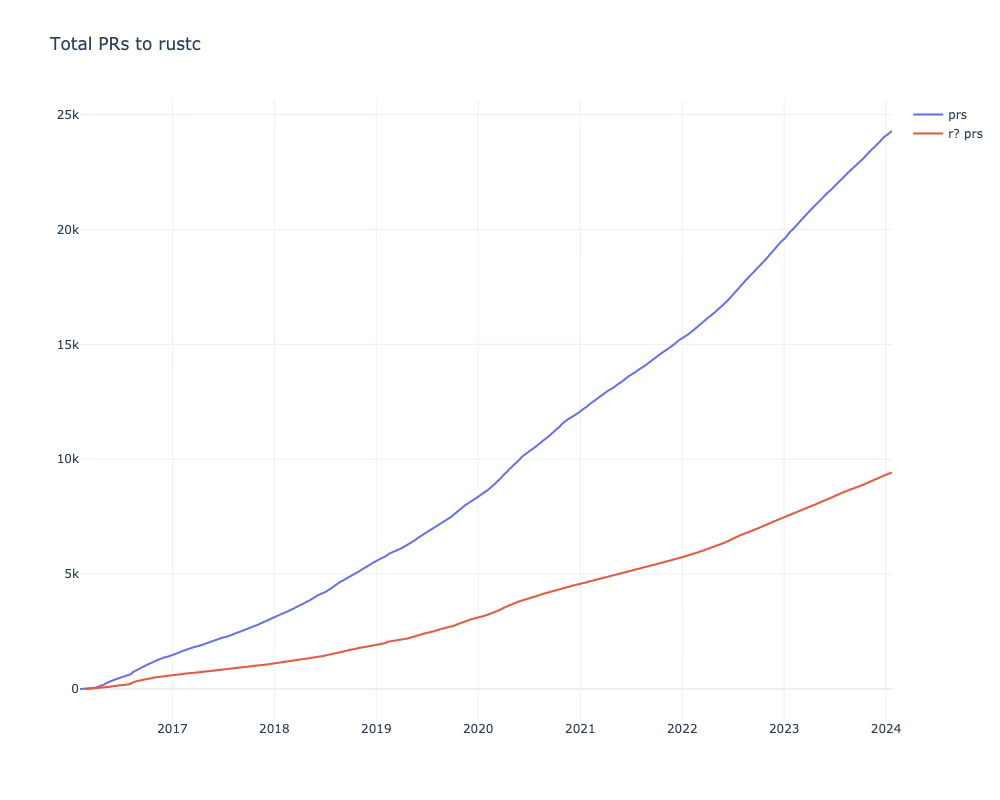
Once I filtered the data to only compiler pull requests, I was left with 24,284 merged pull requests. I looked through the file paths of the merged pull requests that this excluded and it was comprised of rust-analyzer, std, clippy, non-compiler tests, bootstrap, miri, rustdoc - which seems about right to me.
For some of the more variable measurements in graphs below, such as pull-requests-per-week, I’ve applied a moving average to smooth out the graph and make it a little easier to observe the relevant trends.
Let’s start with something very unsurprising - the total number of pull requests we’ve gotten only increases, but we can also observe here that it’s increasing faster in recent years.
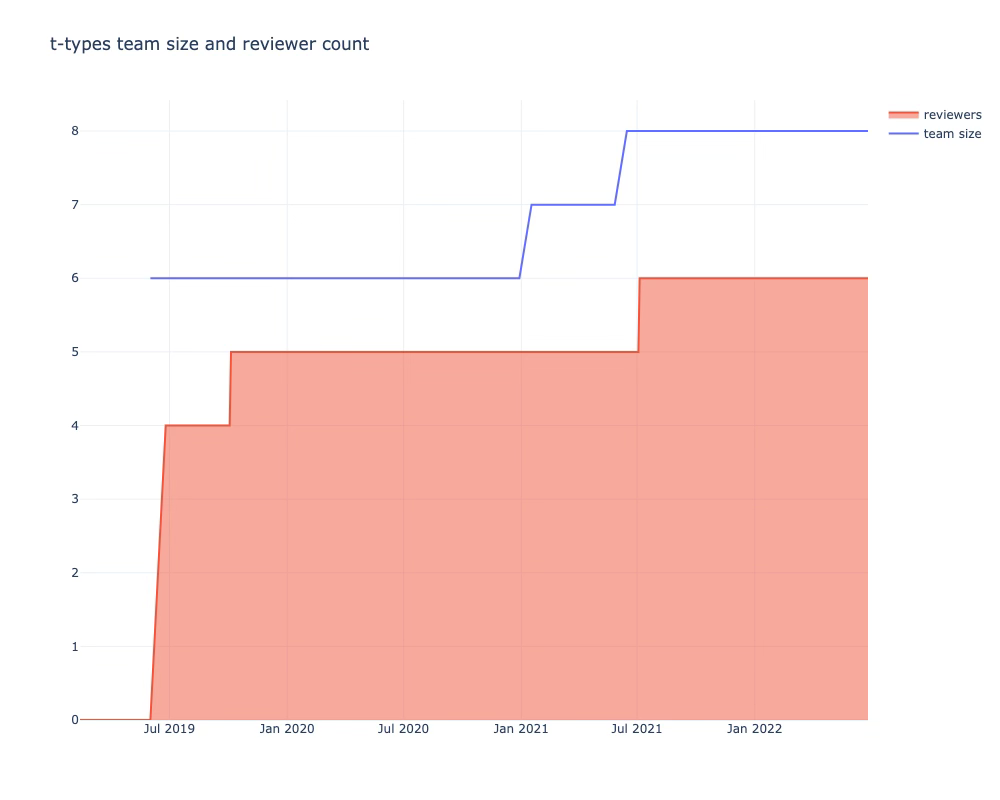
I also gathered data on the team size and number of team members on the reviewer list over time by manually going through the Git history for rust-lang/team, triagebot.toml in rust-lang/rust and rust-lang/highfive before that. I added this data to my SQLite database so that I could query it alongside the pull request data. In July 2020, we split the compiler team’s review queue into team members and team contributors.
Our team has grown over time, counting both contributors and members, but the reviewer list hasn’t grown. In putting together this data, it was clear that the individuals on the review queue has rotated out somewhat - some members have been on the queue for the entire period in the above graph, whereas others drop off and get replaced by other team members.
We can also see that new team members and contributors aren’t being added to the review queue. I remember being encouraged to become a reviewer when I was made a contributor, but I’m not sure if that’s something we do now. It might not make sense for every contributor, but it probably wouldn’t hurt for us to ask new contributors to consider joining the queue.
Since the types team’s inception, its size has remained fairly constant and the team members on the review queue too.
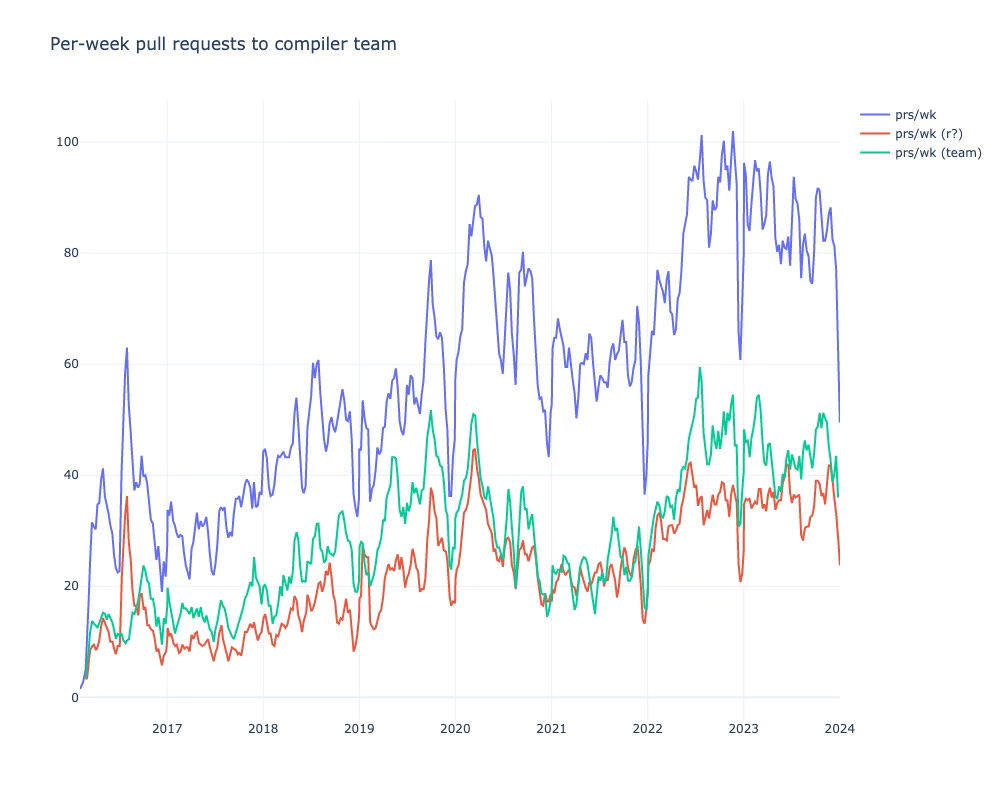
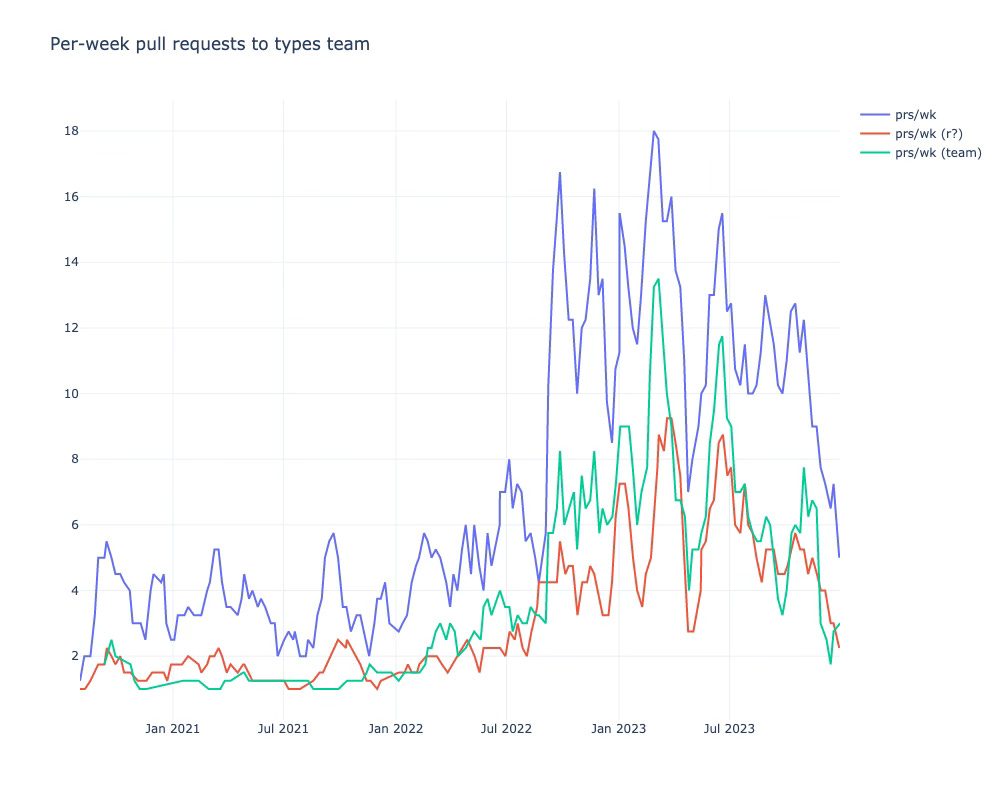
When we look at the number of pull requests submitted to the compiler per week, then we see roughly what we’d expect - there are more today than there were years ago. It looks like roughly a doubling of per week pull requests in 2020-2024 compared to 2016-2020. The share of pull requests which are manually assigned or come from team members hasn’t changed too much in that time.
I considered pull requests to the types team as being those from my compiler pull request data which modified the following paths:
compiler/rustc_hir_analysis*
compiler/rustc_middle/src/traits*
compiler/rustc_middle/src/ty*
compiler/rustc_trait_selection*
compiler/rustc_traits*
compiler/rustc_type_ir*
These are the same paths that we use for types team assignment in triagebot.toml.
Pull requests to the types team compromise around a fifth of the total incoming pull requests and a greater proportion of the pull requests are authored by members of the types team than with pull requests to the compiler in general.
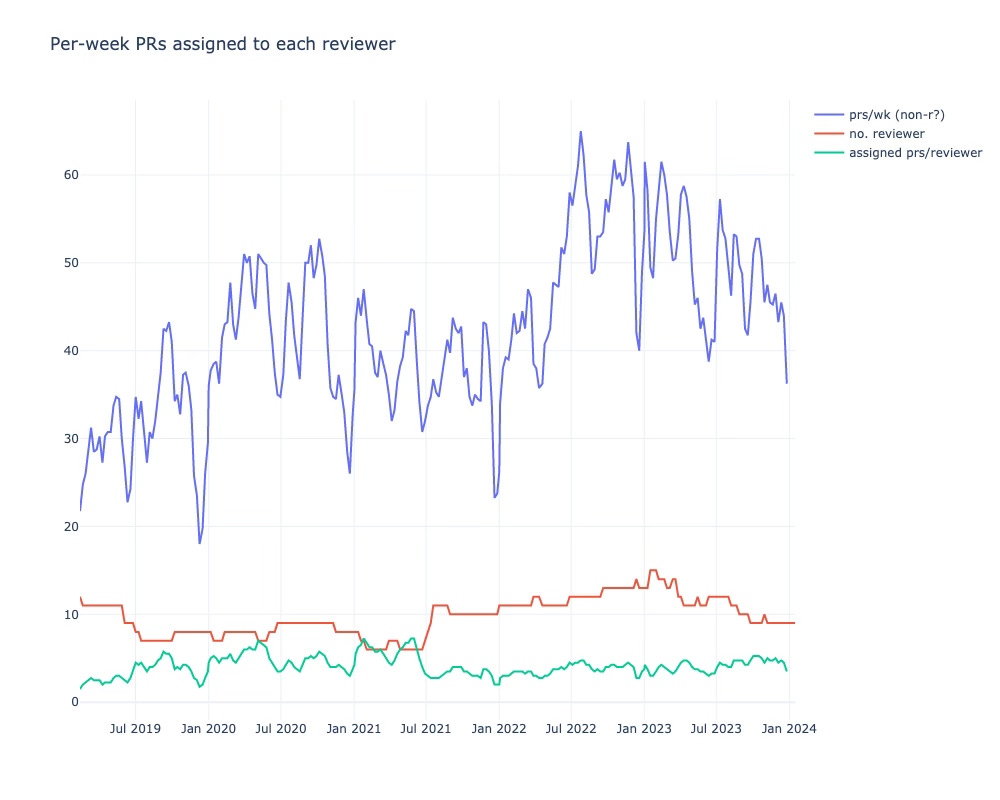
Interestingly, when we look at the non-manually-assigned pull requests submitted each week and work out how many of those would be assigned to each reviewer at that time, we find that the number has been fairly consistent over time.
I spot checked a few of the weeks against my emails (where notifications which assign me are labelled and easily findable) and found that it mostly lined up. Normally I’d have a few more than the graph would predict because of manually-assigned pull requests and pull requests from previous weeks which weren’t merged within that week.
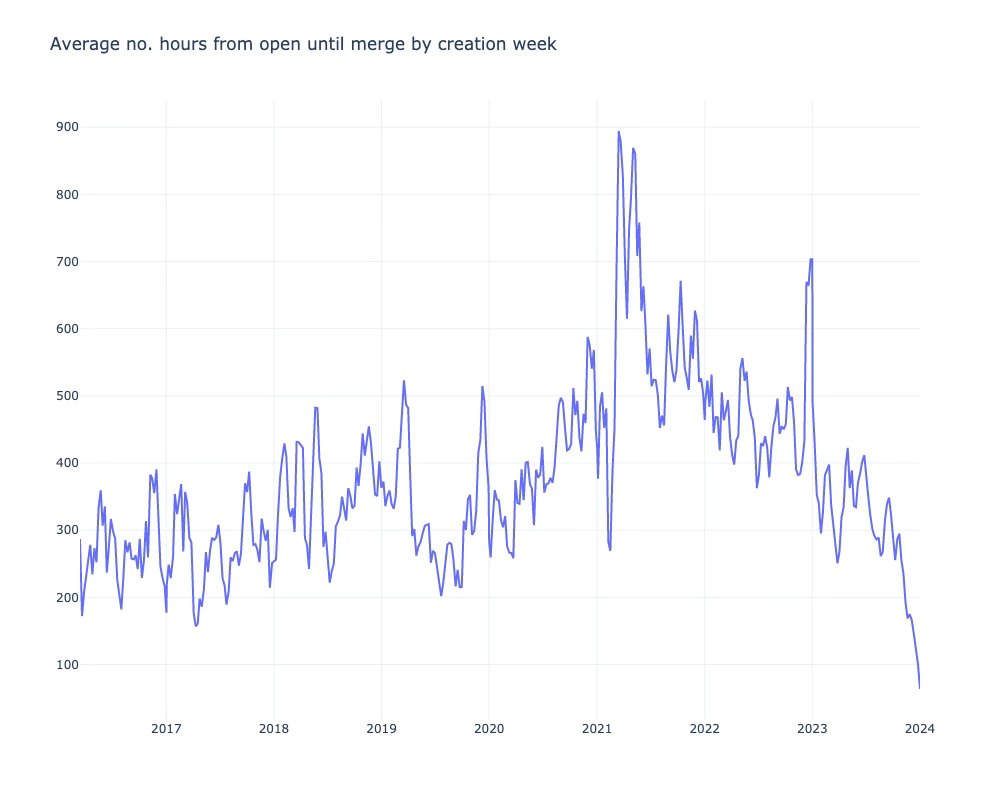
I also thought I’d have a look at the average time between a pull request being opened and being merged for each week. There’s a big spike around the start of 2021 and I’m not really sure why that would be, it doesn’t seem to correspond to an increase in incoming pull requests or any dips in the number of reviewers - maybe just the holidays?
I’m happy to share this data if anyone wants to run their own queries and explore it themselves, just reach out and ask. It’s also possible that I’ve missed something and this data is misleading, so let me know if you spot any issues. All of my scripts are available on GitHub.


